Vision-Based Safe Human-Robot Collaboration
with Uncertainty Guarantees

1Stanford University, 2RWTH Aachen University, 3Shanghai Jiao Tong University, 4Technical University of Munich

Abstract

Safe human-robot collaboration (HRC) requires accurate human pose estimation and motion prediction to prevent critical collisions. Existing certifiable safe HRC approaches are highly conservative or rely on marker-based motion tracking, while vision-based pose estimators lack the statistical guarantees required for certification in accordance with ISO 13849-1.

Hence, we propose a pipeline that predicts 3D human motion and strong probabilistic bounds on the prediction error using conformal prediction. A gradient-based monitor detects out-of-distribution input poses and replaces them with poses from past predicted motions to maintain smooth operation. The resulting conformal prediction sets directly integrate into the provably safe HRC approach SARA shield.

In experiments on the Human3.6M dataset and a real-world HRC setting, our conformal prediction sets have a 7.6 times smaller volume than model-based predictions, and we bound the probability of a dangerous failure per hour by 9.5 × 10−7 with 99.999 % confidence under our test distribution, which is necessary but not sufficient for performance level d.

7.6×

smaller median prediction-set volume than the ISO 13855 constant-velocity model, at the same 99.99 % calibrated confidence

9.5×10⁻⁷

bound on PFHD (1/h) at 99.999 % confidence — inside the PL d band, necessary but not sufficient for PL d

66 ms

end-to-end pipeline latency on one RTX 5090, with 24 % fewer interrupted predictions from OOD handling

What has to be guaranteed

A prediction failure happens when a true joint position leaves the set we predicted for it. That alone is not dangerous — it becomes a dangerous failure only if the robot then actually touches the human.

ISO 13849-1:2023 rates a safety function by its average probability of a dangerous failure per hour (PFHD). Collaborative applications commonly target PL d, i.e. 10−7 ≤ PFHD < 10−6 — at most one dangerous failure in roughly 114 years of 24/7 operation. No vision-based baseline achieves this level of reliability yet.

How It Works

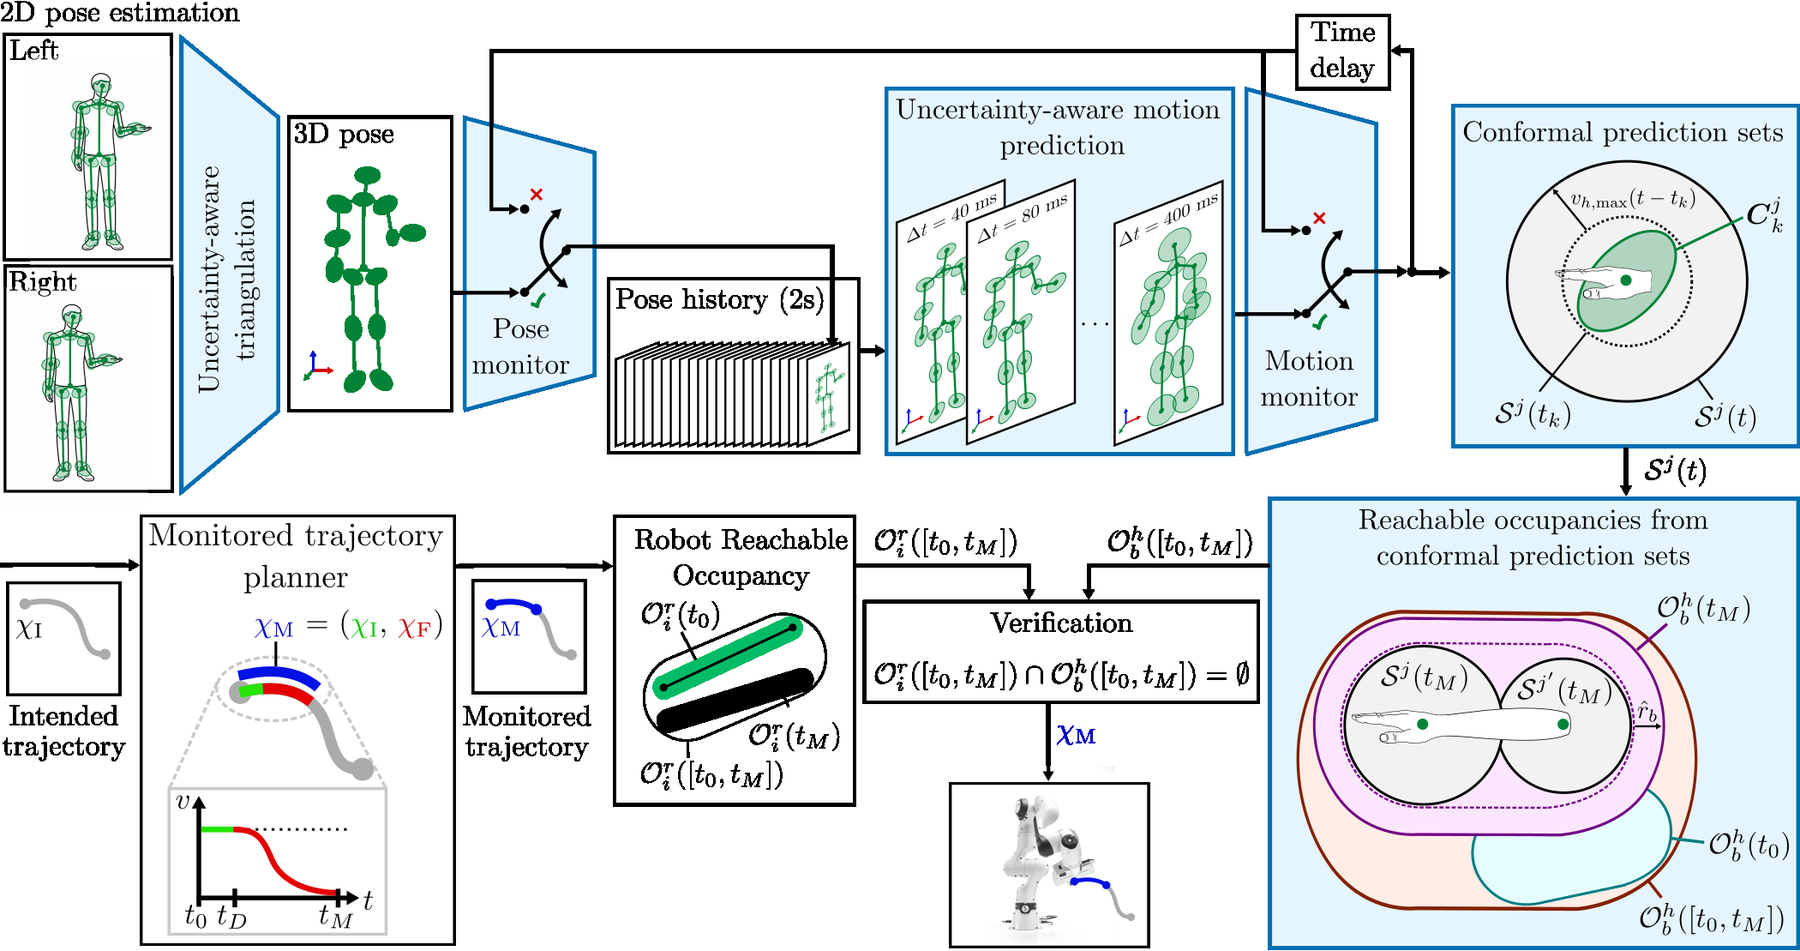
Methodological overview of the safe HRC framework

Overview of our safe HRC framework, with our contributions in blue. We estimate the human pose in the left and right camera image with YOLO26 and compute the 3D pose and its covariances by triangulation. From the past KI poses we predict the next KP 3D poses and covariances. If the pose or motion monitor flags an input as out-of-distribution, we substitute the corresponding pose from the last motion prediction. Conformal prediction bounds then give the reachable occupancy of the human over [t0tM], from the current control step until the robot could be stopped, which SARA shield uses to verify the robot trajectory.

1 Uncertainty-aware 3D pose

We adapt YOLO26 so that it returns a 2D mean and a 2×2 covariance matrix for every joint in both camera frames. Linear triangulation lifts the two 2D poses to a 3D pose with 3×3 covariance matrices.

2 Uncertainty-aware motion prediction

A DCT-based pose transformer takes KI = 50 observed poses (2 s at 25 Hz) with their covariances and predicts the next KP = 10 poses (400 ms) together with heteroscedastic covariances. Because the input uncertainty is embedded and propagated end-to-end, the predicted covariance grows with the horizon and the input uncertainty.

3 Conformal prediction sets

A predicted covariance is not a guarantee. On a held-out calibration split we score every (joint, horizon-step) pair by how far the prediction deviated from the ground-truth in units of the predicted standard deviation, Akj = ‖d2 / √λmax(C), and take the empirical (1 − ε)-quantile αkj. The resulting sphere Skj = B(, αkj √λmax) contains the true joint with probability at least 1 − ε=99.99 %.

4 Out-of-distribution handling

The coverage guarantee needs the test input to be exchangeable with the calibration data, which breaks in unseen situations. Hence, we employ two out-of-distribution (OOD) monitors based on sketched-Lanczos uncertainty scores; one for the pose network and one for the motion network. These monitors score how far an input is from the training distribution. Instead of using an unreliable prediction, the pipeline falls back on the corresponding pose from the previous prediction and resumes normal operation once Nreq consecutive valid observations are present.

5 Verification with SARA shield

We merge adjacent joint spheres into capsules that cover the body radius and account for any time between two predicted steps. These capsules are the human reachable occupancy over the robot's braking horizon. SARA shield checks for intersection between the reachable occupancies of the human and the robot. If there is no intersection, we execute the trajectory, otherwise a failsafe stop.

Results

We evaluate on Human3.6M (train on S1/S6/S7/S8/S9, test on S5, S11 split into validation and calibration) in a dual-camera setup, and in a real-world Franka Emika cell with an Intel RealSense 435i RGB-D camera. Unless stated otherwise: KI = 50, KP = 10, J = 13 joints, 25 fps, εOOD ≈ 10 %, and a calibration confidence of 1 − ε = 99.99 %. We test three hypotheses.

H1 Our conformal prediction sets are less conservative than the ISO 13855 model.
H2 Under our simulated test distribution the system achieves PFHD < 10−6.
H3 OOD handling reduces invalid predictions at a small accuracy cost.

H1 · How tight are the sets?

Both sets cover the ground truth at 400 ms. Orange: SaRA with the ISO 13855 constant-velocity model. Blue: our conformal prediction sets.

We compare against the SaRA tool with the ISO 13855 constant-velocity model (vh,max = 2.0 m/s), calibrated to the same 99.99 % confidence on the last observed pose. At matched coverage our sets have a 7.6× smaller median volume (0.090 m3 vs. 0.686 m3), confirming H1.

There is a clear trade-off between the predicted set size and the observed miss-rate. Dropping conformal calibration for the analytic Gaussian value αk,χj = √χ23(1−ε) gives by far the smallest sets, but it fails PFHD < 10−6 by four orders of magnitude. A single shared threshold αmax has the lowest miss-rate, but 4.6× larger sets than our individual scores.

Table I · Motion prediction evaluation and certification simulation on H36M test data

Method Coverage ↓ Volume (m3) ↓ P(F) ↓ kD ↓ PFHD (1/h)
↓ Miss rate ↑ Nines of reliability 5 % 50 % 95 %
ISO 13855 5.0×10−65.30 0.0170.6863.244 2.87×10⁻³⁰ 1.62×10⁻⁷
Ours (αmax) 1.0×10−66.00 0.0720.4136.352 4.62×10−40 1.91×10⁻⁸
Ours with OOD inputs 1.6×10−43.79 0.0150.0900.654 1.30×10⁻²⁴ 9.48×10⁻⁷
Ours OOD filtered 1.6×10−43.79 0.0150.0900.651 1.30×10⁻²⁴ 9.50×10⁻⁷
No conformal prediction (αk,χj) 6.8×10−32.17 0.0020.0110.174 1.80×10−124,722 1.61×10⁻²

Motion prediction results on H36M test data, and the PFHD evaluation over ND = 2.65×10¹¹ random placement experiments. Miss rate is the rate at which a ground-truth joint position falls outside its predicted set; the nines of reliability are k = −log10(pmiss). P(F) is the per-window prediction-failure rate, and kD the number of placements that ended in contact although the shield had verified the trajectory. The last row drops conformal calibration for the analytic Gaussian value, and is the only variant that misses PFHD < 10−6. PFHD is a bound under the simulated test distribution — not a certified PL.

H2 · Bounding the probability of a dangerous failure

A dangerous failure D requires both a prediction failure F and an actual contact, so D ⇒ F and PFHD = Nh P(FP(D | F), with Nh = 3600 s / tcycle = 9×10⁵ verification cycles per hour at tcycle = 4 ms.

We measure P(F) on the H36M test windows, correcting the effective sample size for the autocorrelation induced by overlapping windows. We then replay every failed prediction at 2.65×10¹¹ random positions, orientations and robot-trajectory phases inside a 10 m radius — a distribution in which the human spends 2.3 minutes per operating hour in the robot's path. Almost no placement can physically reach the robot, so a hierarchy of bounding-sphere filters prunes them before the remaining capsule intersections are batched on the GPU.

Exactly four placements ended in contact despite a verified trajectory. Composing two one-sided Clopper-Pearson bounds gives PFHD ≤ 9.50×10⁻⁷ h−1 at 99.999 % confidence — inside the PL d band, confirming H2.

What this does and does not claim. A bounded PFHD is necessary but not sufficient for a performance level. ISO 13849-1 additionally requires a control architecture of a defined category, sufficient diagnostic coverage, protection against common-cause failures, and measures against systematic and software faults. Our pipeline is single-channel with no hardware redundancy, so it cannot on its own satisfy a fault-tolerant category such as Category 3. We therefore do not claim a certified PL and leave the architectural certification of the integrated system to the system integrator.

H3 · Does the OOD handling pay for itself?

We run the full pipeline on H36M while varying Nreq, the number of consecutive valid observations required before the buffer fallback releases. Nreq = KI = 50 is the degenerate case where any single OOD input invalidates the whole motion prediction; we use Nreq = 3 in the real-world experiments. Going from 50 to 3 reduces invalid pose buffers by 24 % while raising the average MPJPE by only 1.9 %, supporting H3.

The monitors themselves separate cleanly: SLU2D reaches an AUROC of 0.9976 against the tiger-pose dataset, and SLUmot 0.9858 against temporally shuffled inputs.

Table III · Full pipeline on H36M vs. Nreq

Nreq ↓ H invalid [%] ↑ Motion valid [%] ↓ MPJPE [mm]
3 (ours)12.6374.7455.15
513.5273.6255.03
1014.0572.6754.74
5016.5768.7054.14

Per-stage runtime (450 steps, RTX 5090)

StageMean [ms]Median [ms]
2D pose estimation f2D13.40 ± 0.6213.20
Pose OOD detection SLU2D36.48 ± 0.2136.39
Triangulation1.90 ± 0.141.87
Motion prediction fmot4.69 ± 0.044.69
Motion OOD detection SLUmot9.08 ± 0.099.08
Prediction-set computation0.67 ± 0.100.64
Total66.2265.86

The 2D stage includes human detection and both camera views. OOD detection dominates the budget. Measured on an RTX 5090 with an AMD Ryzen 9 9950X, as reported in Sec. IV-D of the paper.

Table II · Motion prediction accuracy on H36M (MPJPE, mm)

Method80 ms160 ms320 ms400 ms
Repeating Last-Frame23.844.476.188.2
One FC14.033.268.081.5
HisRep10.422.647.158.3
ST-DGCN10.322.747.458.5
ST-Trans10.423.448.459.2
SiMLPe9.621.746.357.3
Ours (stage 1)16.523.148.462.4
Ours (final)22.030.756.169.4

Our model is less accurate than the state of the art, most likely because it predicts 13 joints rather than the 22 these baselines report on. For certifiable HRC the calibrated set is what the shield consumes; raw MPJPE is not.

Real-World Deployment

We integrated the pipeline into SARA shield and deployed it on a Franka Emika arm with an Intel RealSense 435i running at 25 Hz. Depth comes straight from the camera, and every 3D pose whose depth deviates by more than 0.8 m from the median depth is marked out-of-distribution — so the OOD monitor catches perception failures directly. In every tested instance the robot came to a complete stop before the human operator could reach it.

Blue: the human's conformal prediction sets over the robot's stopping horizon. When they intersect the robot's reachable set, the shield brakes. Also available as a standalone clip on YouTube.

BibTeX

@article{thumm2026vision,
  title   = {Vision-Based Safe Human-Robot Collaboration with Uncertainty Guarantees},
  author  = {Thumm, Jakob and Frei, Marian and Ni, Tianle and Althoff, Matthias and Pavone, Marco},
  journal = {arXiv preprint arXiv:2604.15221},
  year    = {2026}
}